fig,ax=plt.subplots(figsize=(8,6))
from matplotlib.patches import Polygon, Arc
ax.set_facecolor(bg); fig.patch.set_facecolor(bg)
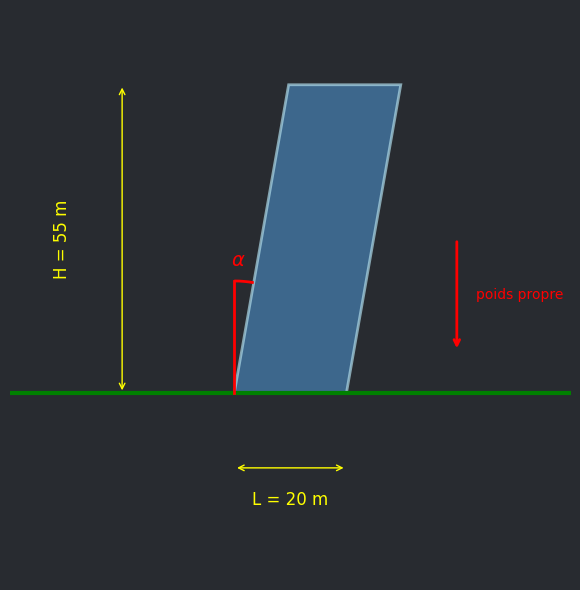
a=np.radians(10.); d=H*np.tan(a); s=0.15
pts=np.array([[0,0],[L,0],[L+d,H],[d,H]])*s
ax.add_patch(Polygon(pts,facecolor='steelblue',edgecolor='lightblue',linewidth=2,alpha=0.7))
ax.axhline(0,color='green',linewidth=3)
# Portee L (sous la tour)
ax.annotate('',xy=(0,-2),xytext=(L*s,-2),arrowprops=dict(arrowstyle='<->',color='yellow'))
ax.text(L*s/2,-3,'L = 20 m',color='yellow',ha='center',fontsize=12)
# Hauteur H (a gauche, degenage de la fleche)
ax.annotate('',xy=(-3,0),xytext=(-3,H*s),arrowprops=dict(arrowstyle='<->',color='yellow'))
ax.text(-4.6,H*s/2,'H = 55 m',color='yellow',ha='center',fontsize=12,rotation=90,va='center')
# Angle alpha (hors de la tour, au-dessus de l'arc)


ax.plot([0,0],[0,3],color='red',linewidth=2)
ax.add_patch(Arc((0,0),6,6,angle=0,theta1=80,theta2=90,color='red',linewidth=2))
ax.text(0.1,3.4,r'$\alpha$',color='red',fontsize=14,ha='center')

# Poids propre (a droite de la tour)
wx=(L+d)*s+1.5
ax.annotate('',xy=(wx,H*s/2-3),xytext=(wx,H*s/2),arrowprops=dict(arrowstyle='->',color='red',lw=2))
ax.text(wx+0.5,H*s/2-1.5,'poids propre',color='red',fontsize=10,va='center')
ax.set_xlim(-6,L*s+6); ax.set_ylim(-5,H*s+2)
ax.set_aspect('equal'); ax.axis('off')
plt.tight_layout()
plt.savefig('c0.png',dpi=150,facecolor=bg)
plt.show()