r_plot = np.linspace(Ri, Re, 100)
srr_th = CuveParams.sigma_rr_pression(r_plot)
stt_th = CuveParams.sigma_tt_pression(r_plot)
ur_th = CuveParams.u_r_pression(r_plot)
bg = (40/255, 43/255, 48/255, 1.0)
idx = np.argsort(r_nodes)
r_sorted = r_nodes[idx]
ur_sorted = ur_p[idx]
n_cells = domain.topology.index_map(domain.topology.dim).size_local
cell_midpoints = mesh.compute_midpoints(domain, domain.topology.dim, np.arange(n_cells, dtype=np.int32))
r_cells = np.sqrt(cell_midpoints[:, 0]**2 + cell_midpoints[:, 1]**2)
idx_cells = np.argsort(r_cells)
r_cells_sorted = r_cells[idx_cells]
fig, axes = plt.subplots(1, 3, figsize=(16, 5))
fig.patch.set_facecolor(bg)
ax = axes[0]
ax.set_facecolor(bg)
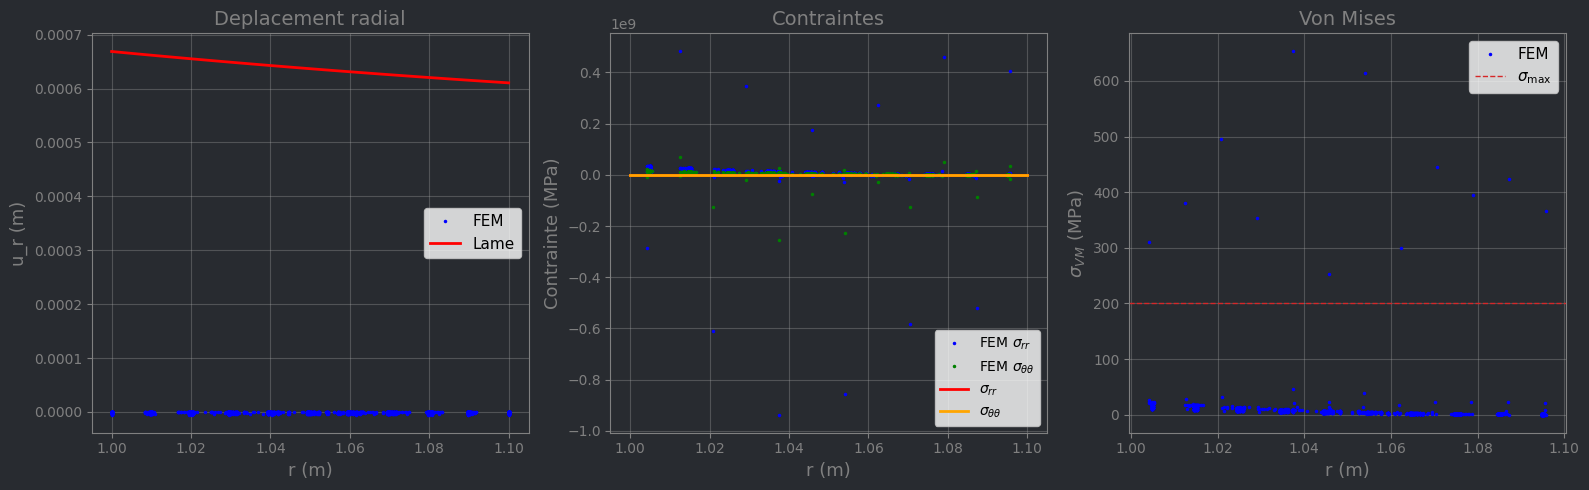
ax.plot(r_sorted, ur_sorted, 'b.', markersize=3, label='FEM')
ax.plot(r_plot, ur_th, 'r-', linewidth=2, label='Lame')
ax.set_xlabel('r (m)', fontsize=13, color='grey')
ax.set_ylabel('u_r (m)', fontsize=13, color='grey')
ax.set_title('Deplacement radial', fontsize=14, color='grey')
ax.legend(fontsize=11); ax.grid(True, alpha=0.3); ax.tick_params(colors='grey')
for sp in ax.spines.values(): sp.set_color('grey')
ax = axes[1]
ax.set_facecolor(bg)
ax.plot(r_cells_sorted, sig_p_vals[idx_cells, 0], 'b.', markersize=3, label=r'FEM $\sigma_{rr}$')
ax.plot(r_cells_sorted, sig_p_vals[idx_cells, 1], 'g.', markersize=3, label=r'FEM $\sigma_{\theta\theta}$')
ax.plot(r_plot, srr_th/1e6, 'r-', linewidth=2, label=r'$\sigma_{rr}$')
ax.plot(r_plot, stt_th/1e6, 'orange', linewidth=2, label=r'$\sigma_{\theta\theta}$')
ax.set_xlabel('r (m)', fontsize=13, color='grey')
ax.set_ylabel('Contrainte (MPa)', fontsize=13, color='grey')
ax.set_title('Contraintes', fontsize=14, color='grey')
ax.legend(fontsize=10); ax.grid(True, alpha=0.3); ax.tick_params(colors='grey')
for sp in ax.spines.values(): sp.set_color('grey')
ax = axes[2]
ax.set_facecolor(bg)
ax.plot(r_cells_sorted, vm_p[idx_cells]/1e6, 'b.', markersize=3, label='FEM')
ax.axhline(p.sigma_max/1e6, color='tab:red', ls='--', lw=1, label=r'$\sigma_{\max}$')
ax.set_xlabel('r (m)', fontsize=13, color='grey')
ax.set_ylabel('$\sigma_{VM}$ (MPa)', fontsize=13, color='grey')
ax.set_title('Von Mises', fontsize=14, color='grey')
ax.legend(fontsize=11); ax.grid(True, alpha=0.3); ax.tick_params(colors='grey')
for sp in ax.spines.values(): sp.set_color('grey')
plt.tight_layout(); plt.show()