import matplotlib.pyplot as plt
import numpy as np
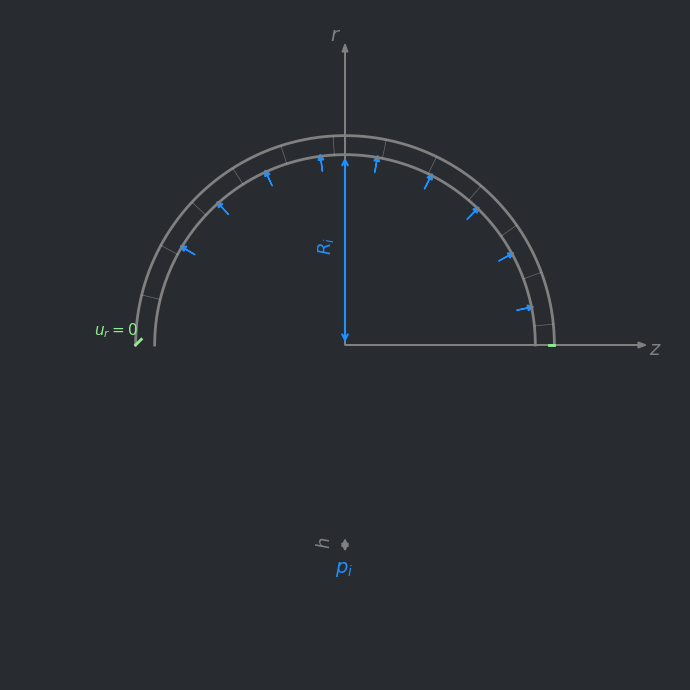
def plot_cuve(Ri=1.0, h=0.1):
Re = Ri + h
bg = (40/255, 43/255, 48/255, 1.0)
fig, ax = plt.subplots(figsize=(7, 7))
fig.patch.set_facecolor(bg); ax.set_facecolor(bg)
# Demi-cercle intérieur et extérieur
theta = np.linspace(0, np.pi, 200)
ax.plot(Ri*np.cos(theta), Ri*np.sin(theta), 'grey', linewidth=2)
ax.plot(Re*np.cos(theta), Re*np.sin(theta), 'grey', linewidth=2)
# Hachurage de l'épaisseur
for t in np.linspace(0.1, 2.9, 12):
r = Ri + h/3
ax.plot([Ri*np.cos(t), Re*np.cos(t)], [Ri*np.sin(t), Re*np.sin(t)],
color='lightgrey', linewidth=0.5, alpha=0.4)
# Axes
ax.arrow(0, 0, 1.4*Re, 0, head_width=0.03, head_length=0.04, color='grey')
ax.arrow(0, 0, 0, 1.4*Re, head_width=0.03, head_length=0.04, color='grey')
ax.text(1.45*Re, -0.05, "$z$", color='grey', fontsize=14)
ax.text(-0.08, 1.45*Re, "$r$", color='grey', fontsize=14)
# Cotes
ax.annotate("", xy=(0, -Ri), xytext=(0, -Re),
arrowprops=dict(arrowstyle="<->", color='grey', lw=1.5))
ax.text(-0.15, -(Ri+Re)/2, "$h$", color='grey', fontsize=13, rotation=90)
ax.annotate("", xy=(0, 0), xytext=(0, Ri),
arrowprops=dict(arrowstyle="<->", color='dodgerblue', lw=1.5))
ax.text(-0.15, Ri/2, "$R_i$", color='dodgerblue', fontsize=13, rotation=90)
# Pression interne
for angle in [0.2, 0.5, 0.8, 1.1, 1.4, 1.7, 2.0, 2.3, 2.6]:
x = (Ri - 0.08)*np.cos(angle)
y = (Ri - 0.08)*np.sin(angle)
ax.arrow(x, y, 0.06*np.cos(angle), 0.06*np.sin(angle),
head_width=0.03, head_length=0.03, color='dodgerblue')
ax.text(-0.05, -1.2, r"$p_i$", color='dodgerblue', fontsize=14)
# Conditions aux limites
ax.plot([-Re, -Re+0.03], [0, 0.03], 'lightgreen', linewidth=2)
ax.plot([Re-0.03, Re], [0, 0], 'lightgreen', linewidth=2)
ax.text(-1.2*Re, 0.05, r"$u_r = 0$", color='lightgreen', fontsize=11)
ax.set_xlim(-1.6*Re, 1.6*Re)
ax.set_ylim(-1.6*Re, 1.6*Re)
ax.set_aspect("equal"); ax.axis("off")
plt.tight_layout(); plt.show()
plot_cuve()